Part of the Expert4x Premium Forex Trading CLUB
Risk Analysis Information
.
SELECTING THE BEST ACCOUNTS TO LINK TO
The table below (Top Account Risk Analysis Information) provides guidance on how to select the best accounts to follow. It is created by comparing the Equity Balances for each account at a high level on a weekly analysis basis. You may need further analysis, but click on the blue links provided, and you will be taken to the FXBlue account analysis. Please treat the information provided as the first phase of account selection and apply any other necessary investigations.
The key criteria for selecting accounts are:
- CURRENT OPEN TRADES: Details can be found by sorting the Floating P/L Column from large to small. It is best not to select accounts with large negative Floating loss balances, as you may not experience new trades while the drawdown is resolved.
- PROFITABILITY: Recent and past profitability details can be found in 2 columns. The “Gains in the last 8 weeks” and the “Gains since listed” columns. You want to link your account to profitable accounts, especially ones that have been profitable in the last 8 weeks.
- CONSISTENCY: Consistency is measured by the number of profitable weeks in the last 8 weeks. That is not shown but the number of “negative weeks in the last 8 weeks” are shown. Sort this from small to large. You want to choose accounts with the lowest negative weeks in the last 8 weeks.
- LOW DRAWDOWNS: The number of negative weeks in the last 8 gives you an idea of the account's exposure to drawdown weeks. Also supplied is the total value of negative weeks in the previous 8 weeks is provided. This gives you an idea as to the risk you are exposing yourself to. There is also a ratio that compares the net Gains to the $ total negative weeks in the last 8 weeks called the “Return on Total DD”.
- RISK EXPOSURE: The “Best $ week in the last 8 weeks” column gives you an idea of the profit potential of the account. The “Worst week in the last 8” column gives you an idea of the high levels’ drawdowns can reach. Ideally, you should choose an account with high weekly potential and a lower weekly loss number.
- CURRENCY EXPOSURE: Make sure you do not overexpose your linked account portfolio to any 1 or 2 currencies only. Currency information can be obtained from the FXBlue links
In general, traders review accounts and settings regularly, so the last eight weeks are more important than what happened before that. For more details, click on the FXBlue links.
In the table below the most important columns have been colour coded to assist with Account selection. The Light Green Colours represent the account in the top 30% of linkable accounts. The Pink colours represent the 30% bottom performers. The information in the table should supply considerable criteria for account selection but it is still up to the Investors to do more due diligence of their own. The guidance should not be regarded as advice but as an analysis of actual facts.
Please sort the columns in the table below by the Account Selection Criteria that you deem important.
Popular sorting approaches are:
-
% Gain in the last 8 weeks: Most linked account traders are most interested in accounts that have produced the best bankable gains
-
% Return on Total drawdown: This is a way of comparing the gains made (return) to the drawdowns (Risk)
-
No of negative weeks: This is a important measure of consistent profitable trading.
-
Floating P/L: It is often not a good idea to start linking to an account that is currently experiencing a large drawdown as the account can get stuck in a period of no new open trades.
If you have problems using Risk Analysis table below, please use the download button and use the spreadsheet on your computer.
Downloads
RISK MANAGEMENT
Getting the balance between gains and drawdowns is tricky. We are focusing on lower drawdowns, and as such, many accounts have conservative gains. Depending on your risk tolerance you might not mind more risk for more significant gains.
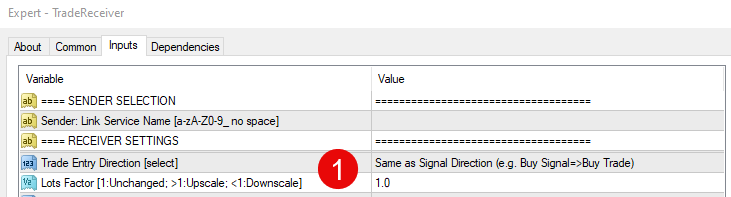
This can be done by changing the lot Factor in the Receiver Robot to be higher than 1. 1.5 would increase potential risk and gains by 50%.